At Churchill Support Services, we’ve long been passionate about ranking the most dangerous areas of London. Knowing the crime stats for your area can help you protect yourself and your business from crime, as well as help you decide what security services you need to put in place.
For this year’s ranking, we’re using the most recent data that’s available from the Metropolitan Police, looking at data from February 2023 to January of 2024. By ‘most dangerous’, we mean the areas with the highest crime rate.
Instead of ranking areas in terms of the total number of crimes committed, we’ve looked at crime rates in proportion to the population for each of the 15 worst boroughs in London, ranking them based on the number of offences committed per 1,000 people.
This not only allows us to take into consideration key factors like population and area density, it also means we can provide a more objective overview of the most dangerous areas in London.
The UK’s capital city, and a hub for British tourism, commerce and culture, London is as synonymous with the winding banks of the Thames as it is with the fast-paced and often high-octane business world of Canary Wharf and Westminster.
It’s a huge melting pot of different ways of life, from the more tranquil surroundings of the city’s major parks, to the hustle and bustle of traditional markets that fill the air with a cacophony that harks back to London’s illustrious history. There’s no words to fully describe London, and with a staggering 30 million visitors each year, it clearly holds appeal for a range of different people.
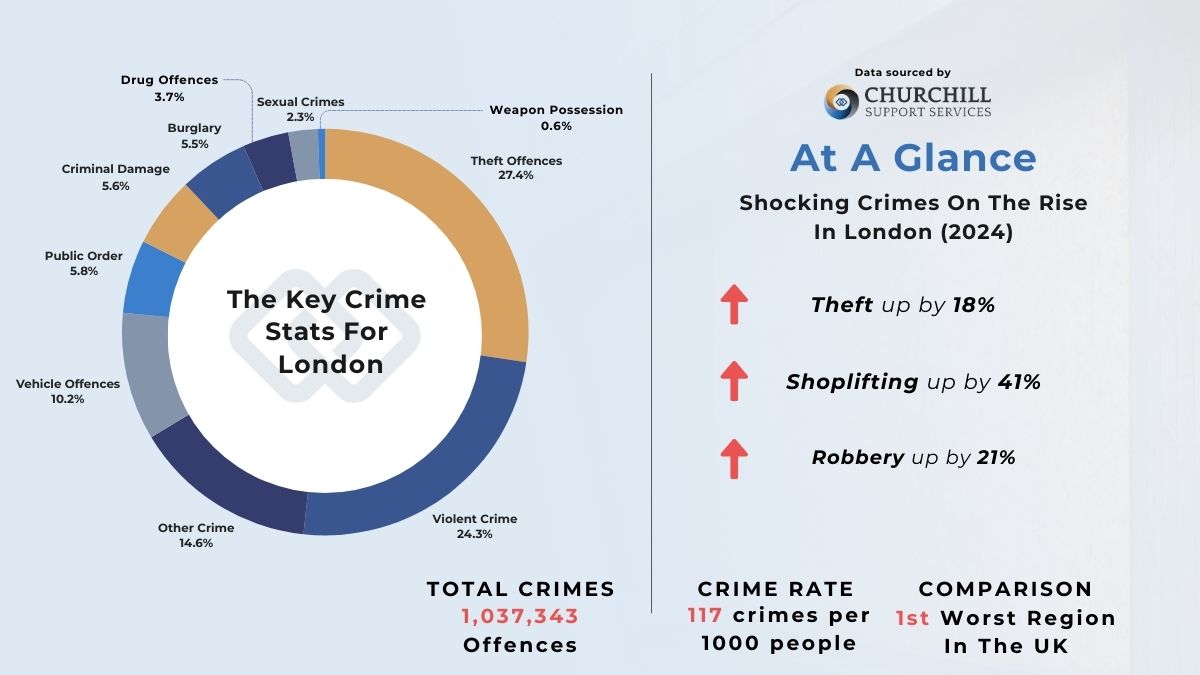
Of course though, that popularity does create its own issues, and that’s most apparent in London’s worrying rate of crime. The city sees 117 crimes per 1000 residents, a 6.5% rise when compared to the previous year’s statistics.
The chief concern for residents and businesses in the city is the soaring rates of theft (283,902 offences) and violent crime (252,568 offences), both of which have seen rises when compared to the statistics we saw in previous years, alongside equally concerning numbers in vehicle crime (105,570 offences) and arson & criminal damage (58,072 offences)
Of course, this only tells a partial story, with London’s myriad of different districts and areas all seeing their own unique issues with criminal activity. Let’s break down the 15 most dangerous areas of London, and how their rate stacks up in comparison to the city as a whole.
You’ll notice that we’ve not included the City of London district in our list, and for good reason. The region is only a permanent home to around 8,600 people, but with over half a million people working in the area, it sees a hugely disproportionate number of criminal offences.
Over the last year, the City of London saw a massive 7,496 criminal offences, meaning a shocking 869.8 crimes per 1000 residents, or almost 9 crimes per 10 people living in the region. Of course, this is significantly offset by the number of out-of-area commuters, so it’s difficult to fully gauge how bad crime is in this area of the city.
For this reason, we’ve opted to not include it on our list of the most dangerous areas in London, but tourists, commuters and residents alike should still be mindful of the issues that the district faces.
With convenient access to Heathrow Airport and the M14, Hounslow is a well-connected area of London, best exemplified by its diverse cross-section of residents, and its vibrant, multi-cultural events calendar. That popularity and extensive schedule, however, means Hounslow finds itself as the 13th most dangerous area in London.
The borough sees an overall crime rate of 110.4 crimes per 1000 residents, with the key concern for residents being a rising rate of violent crime (9044 offences). Coupled with similarly worrying figures in both theft (6086 offences) and vehicle crime (4056 offences), the pressing need for security in Hounslow is abundantly clear.
Located in the south-east of London, Lewisham borders the River Thames. Whilst it’s most known as a busy urban area, it is simultaneously home to multiple green spaces, with Mountsfield Park and Ladywell Fields offering sweeping vistas of the riverside and the urban sprawl. It’s also a student hotspot, with the prestigious educational hub of Goldsmiths at Lewisham’s heart.
However, the borough’s high overall crime rate (113.9 crimes per 1000 residents) means it makes it onto the list as the 15th most dangerous area in London. That’s further compounded by Lewisham’s soaring rates of both violent crime (9662 incidents) and theft (6854 incidents).
Greenwich’s picturesque riverside setting makes it one of the most attractive areas in London, overlooking the borough’s eponymous Park and the Royal Observatory. Despite the idyllic features of Greenwich, though, its high overall rate of crime (115.3 crimes per 1000 residents) means it’s 13th place on our list of most dangerous London areas.
They key issues lie in rising numbers of violent crimes (9914 incidents), theft (6510 incidents) and vehicle crimes (3105 incidents), as well as one of the highest proportions of drug offences (1439 incidents) we’ve seen thus far.
Located in the East of London, Barking & Dagenham has evolved from its industrial roots to include a range of public sector services, retail, healthcare, and more. With its history of fishing, farming, and manufacturing, the area has undergone extensive regeneration. Despite this, the borough is still one of the most deprived areas of the city, with nearly half of its children living in poverty.
That’s perhaps most apparent in the borough’s rising levels of crime, with a rate of 115.7 crimes per 1000 residents. The chief concern for residents and local businesses is the rate of violent crime (7573 offences), with an alarming 196 instances of weapon possession in the last year alone. High rates of theft (4520 offences) and vehicle crime (2714 offences) further compound the issues in the borough.
As one of the host boroughs for the 2012 Olympics, Newham is a prominent destination for sports and culture events, playing host to both the ExCeL centre and West Ham’s London Stadium. It’s this undoubted popularity, however, that means Newham sees itself fall onto the list of the most dangerous areas of London, with a crime rate of 122.7 crimes per 1000 residents.
Theft (12,126 incidents) is Newham’s biggest issue, with more than 2304 incidents of shoplifting included as part of that soaring number. There’s also equally concerning rates of violent offences (10,857 incidents) and vehicle offences (4901 incidents).
Located just across from Westminster and the city centre, Lambeth is an attractive area with strong connections to the beating heart of central London. With an extensive array of additional tourist attractions, including the Imperial War Museum and Florence Nightingale Museum, Lambeth is naturally an attractive spot for tourists and residents alike.
Unfortunately, Lambeth has secured a spot on our most dangerous because of its significant overall crime rate of 126 crimes per 1000 residents. High instances of theft (11,566 offences) and violent crime (9940 offences) are Lambeth’s main concerns, with 8 instances of homicide having made headlines in the borough.
Covering much of London’s traditional East End, Tower Hamlets is known for its rich diversity, international cuisine, and melding of cultures. However, as one of the most deprived areas of the capital, it experiences a crime rate that is all too often associated with poverty – 128.9 crimes per 1000 residents.
Tower Hamlets has seen a substantial rise of 10% when compared to the previous year’s figures, with theft (10,989 offences), violent crimes (10,716 offences) and vehicle crimes (3197 offences) all having seen higher numbers than we’ve previously witnessed in the borough.
One of London’s leafiest boroughs, it’s Haringey’s close proximity to the Metropolitan green belt that means it offers sweeping vistas of London’s rural roots, especially from the region’s towering reaches at Alexandra Palace. However, despite the obvious attractions, Haringey’s crime rate of 129.1 crimes per 1000 residents strikes a sour note for residents and businesses alike.
Violent crime (8216 offences) and theft (8039 offences) are the two main contributors towards the crime rate that earns Haringey a spot on our list of the most dangerous areas in London. However, startling figures in domestic burglary (1297 offences) and theft from a motor vehicle (2586 offences) also serve to underscore the pressing need for security in the Haringey area.
Mostly known from being the home of the literarily iconic Globe Theatre, contrasting with the sleek modern architecture of the Shard, you’d be forgiven for not expecting Southwark to be one of the most dangerous boroughs of London. However, with an overall crime rate of 135.7 crimes per 1000 residents, Southwark finds itself in our list.
Theft (14,726 incidents) is, perhaps unsurprisingly, the most pressing concern for residents, making up approximately a third of all crime across the borough. Violent crime (9194 incidents) is the next most prevalent, with burglary (2562 incidents) and vehicle crime (2765 incidents) presenting equally concerning upwards trends.
An East London melting pot of culture, commerce and independent businesses, Hackney lends its name to the iconic London black cabs, as well as the marshes and greenery that characterise one of London’s most well-recognised boroughs. In spite of that sparkling reputation, however, Hackney makes it onto our list of the most dangerous areas in London with a crime rate of 139.5 crimes per 1000 residents.
Perhaps the most concerning statistics are Hackney’s high rates of theft (10,574 incidents) and violent crime (8781 incidents), which have both seen a substantial rise over the statistics we saw in previous months. Plus, there’s been a startling trend of bicycle theft (1419 incidents), which is unprecedented across most London boroughs.
Renowned for its historic terraces and high-achieving schools, Hammersmith and Fulham has since built an equally impressive reputation for its sports scene, being the only London borough to have 3 professional football teams within its borders. That sporting prowess is undercut, however, by the borough’s shocking crime rate of 140.2 crimes per 1000 residents.
Hammersmith & Fulham’s main issues lie in alarming rates of both theft (7144 offences) and violent crime (5967 offences), with vehicle crimes (3186 offences) being an additional point of concern. Plus, with the football crowds often drawing in the wrong sorts of people, violence both without (4014 offences) and with injury (1952 offences) are all too commonplace.
Perhaps a surprise entry, Islington – the second smallest borough in London – is better known as a hub of progressive ideas and bohemian subcultures. This is due, in part, to Islington being home to two universities: London Metropolitan University and the University of London. Nevertheless, the borough experiences a soaring rate of crime, at 145.2 crimes per 1000 residents.
Islington’s main issues lie in worryingly high rates of theft (10,267 offences) and violent crime (7144 offences), both of which have seen an increase in comparison to last year’s figures. Plus, in spite of Islington’s relatively small size, it still sees its fair share of crimes we’d norm ally associate with larger boroughs, such as drug crime (1196 offences) and domestic burglary (1188 offences).
The Royal Borough of Kensington and Chelsea is most commonly associated with the affluence and wealth of the city’s elite, so it may come as a surprise to see the home of Hyde Park and the Flower Show in 3rd on our rankings of the most dangerous areas of London. However, a year-on-year increase has seen Kensington & Chelsea’s crime rate reach 174.5 crimes per 1000 residents.
As such a prosperous borough, it’s perhaps disheartening to learn the region’s biggest problem lies in its high rate of theft (9837 offences), with theft from the person (2531 offences) and shoplifting (1848 offences) making up a substantial portion of that rate. There’s also equally warranted worries around the rates of violent crime (4660 offences) and vehicle crime (2982 offences).
Camden is a centre of cutting-edge fashion, live music, and thriving alternative cultures. Tourists flock to Camden to visit the British Museum, London Zoo, and of course, the famed Camden Market. Despite its tourist popularity, the area makes it to 3rd place on the list of the most dangerous areas in London with an overall crime rate of 197.8 crimes per 1000 residents.
By a staggering margin, theft (18,799 incidents) is Camden’s main problem, making up a whopping 44% of the borough’s total crime figures. The figures in both violent crime (7783 incidents) and vehicle offences (3207 incidents) are equally concerning for residents and businesses in the area, especially with the total crime having risen by a whopping 12% over last year’s figures.
Home to much of the lively West End, the Houses of Parliament, and Buckingham Palace, Westminster is a bustling hub of activity throughout the year. From the regal to the legal, it’s why many turn to London as a key tourist attraction, and for city breaks and getaways alike. However, the borough’s crime rate strikes a sour note, ranking number 1 in our list of the most dangerous areas of London.
With an appalling crime rate of 462.8 crimes per 1000 residents, or almost 1 crime per 2 people, it’s easy to recognise the concerns for Westminster. Theft (58,036 incidents) is by far and away the biggest issue in the borough, but there’s also soaring numbers in violent crime (11,960 offences), vehicle crime (4469 offences), and robbery (4317 incidents). All of this combines to show a shocking 14.8% increase over last year’s statistics.
As we continue to go through the cost of living crisis, data is starting to emerge about how this is impacting UK crime rates. While it’s difficult to say for certain whether the cost of living crisis has had a direct impact on safety in London, crime rate increases across 30 of the 32 London boroughs does suggest it has.
Let’s take a more in-depth look at that. In 2022/2023, statistics found that more than 6500 people were caught stealing from their employer, a year-on-year increase. This is not only indicative of the difficult times we’re living through, but also of the opportunistic nature of thieves, with insurer Zurich placing the average cost of commercial crimes at around £140,000.
Specifically in London, the Metropolitan Police dealt with the highest rate of theft by employees, with 874 offences reported, while the City of London’s police force saw just 18 instance of employee theft.
Of course, while theft from workplaces and offices is a concrete sign that many are turning to criminal activity in the wake of a cost of living crisis, there are other figures that could equally point towards money woes.
Here are a few standout statistics on select crimes in London, and their increases over the previous year’s statistics:
Ultimately, as budgets tighten and we all feel the squeeze of rising interest rates and the soaring costs of everyday essentials, these numbers are only likely to increase.
It’s well-documented that knife crime has often been an issue in the capital, and indeed across the UK. Of the 48,716 offences involving a knife or other sharp instrument, 28.9% (13,957 offences) of these happened in and around London. This is just the recorded instances – the actual figures could be much higher.
Look more closely at the recorded data, more than half (7996 offences) of all knife crime incidents were part of an armed robbery or burglary, while more than 30% were used in violent assaults or instances of bodily harm with injury. On top of that, there were 1,014 threats to kill that involved knives, as well as 231 instances of rape and sexual assault that involved a knife.
Of the 261 instances of homicide (murder) that happened over the last year, 65 (or just under 25%) of these were in the London city area. That’s a marked increase over the previous year’s figures, but we’ve yet to reach the numbers we saw pre-pandemic.
This reduction is due in large part to the efforts of charities like The Ben Kinsella Trust, as well as contined security efforts across the capital. While they’re predominantly focused on youth knife crime, which we’ve discussed in depth in our article on knife violence in schools, their work is changing perceptions, and providing education and effective preventative measures.
There’s still a long way to go, of course, as the statistics we’ve highlighted here do too good of a job in illustrating. But with continued and concerted efforts, this can change, and change quickly. Education is the first part of that, and articles like ours, alongside the ongoing work of charities and initiatives, aim to the insight we need to take the right path.